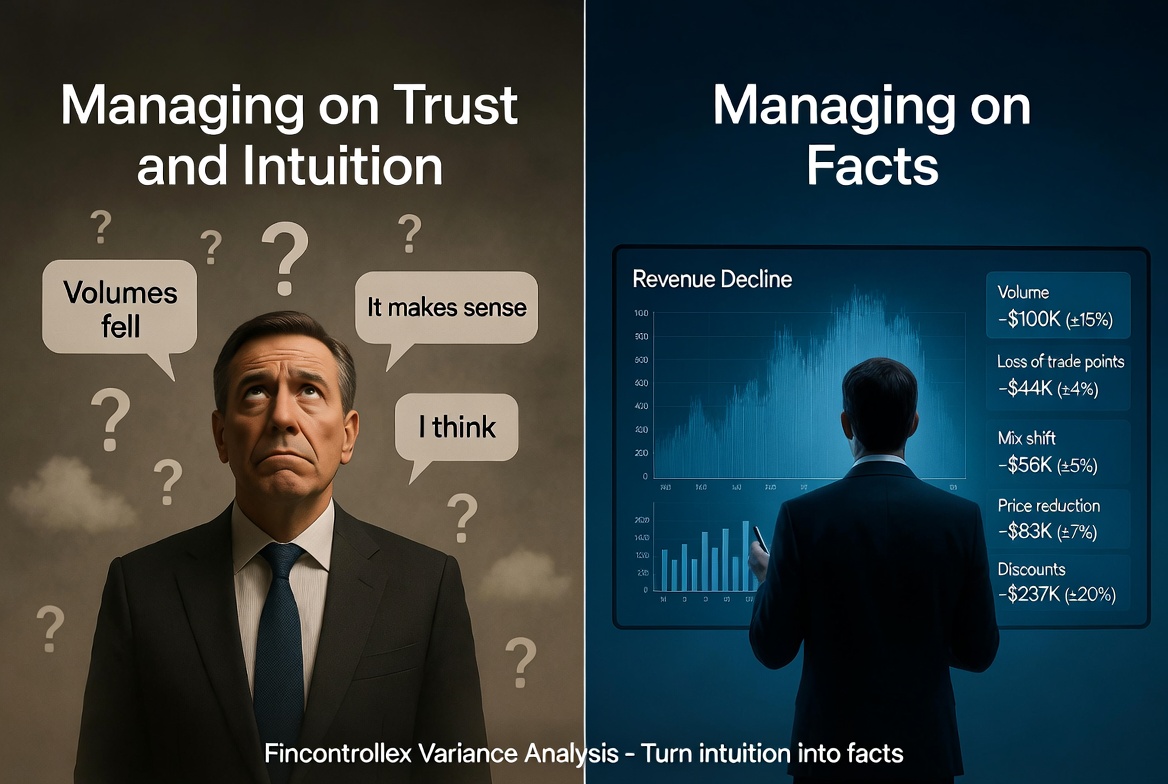
Most companies believe they manage on facts. In practice, they manage on trust and intuition. This article explains why employee explanations often replace real analysis — and how Fincontrollex Variance Analysis reveals the exact cause of every variance.
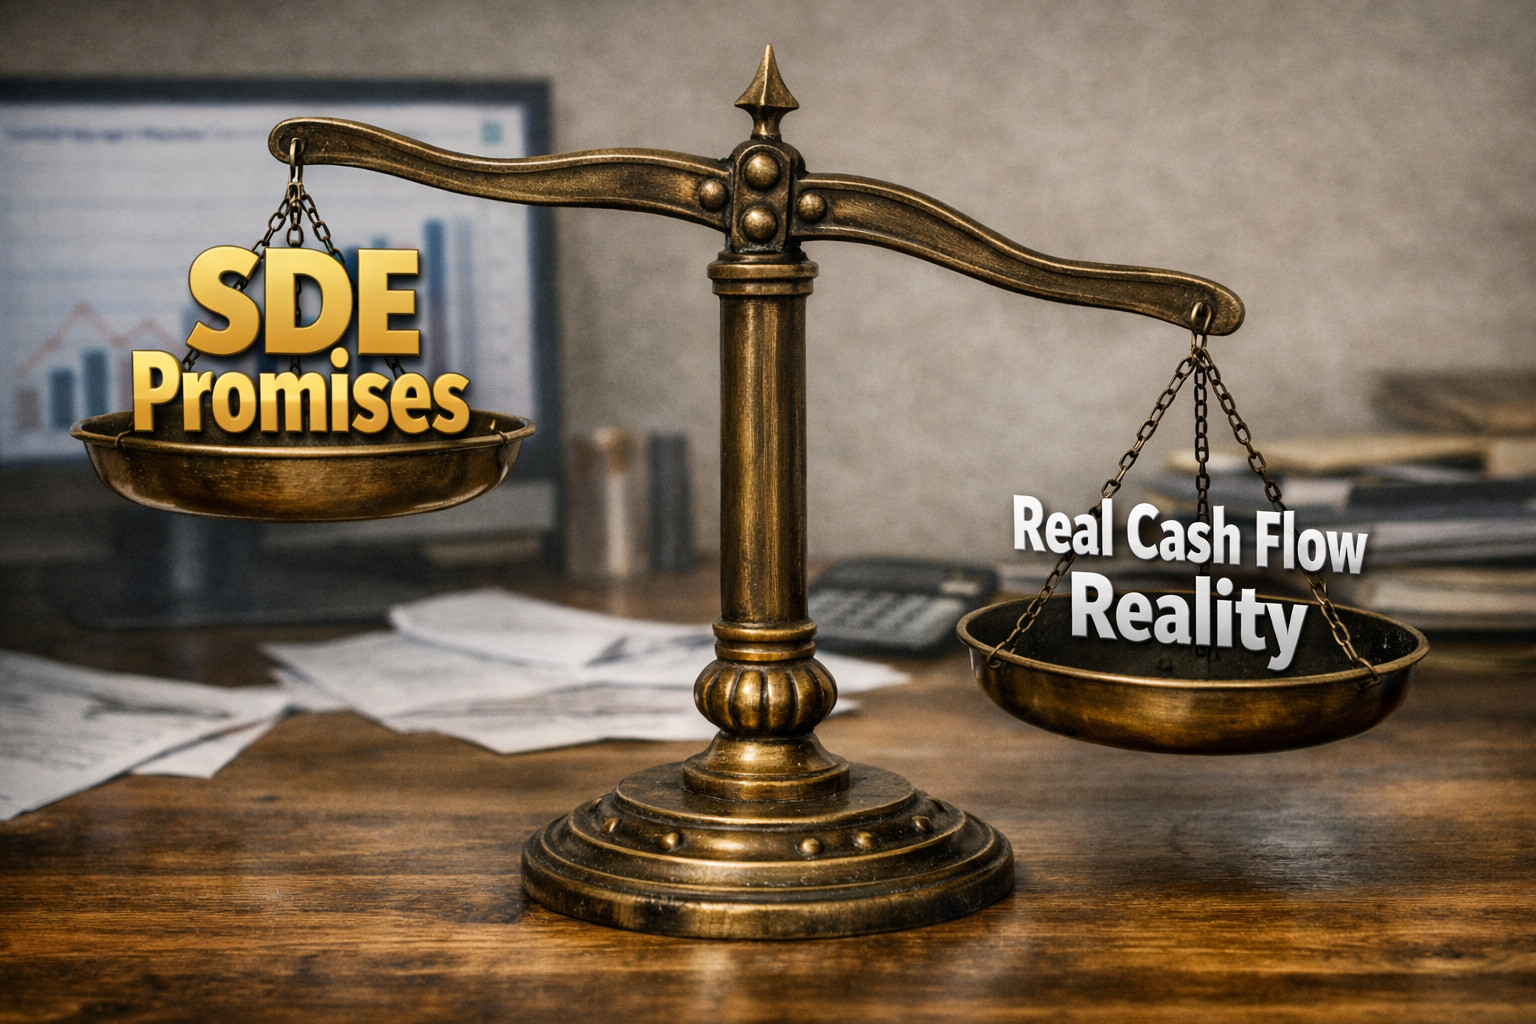
Many buyers rely on Seller’s Discretionary Earnings (SDE) when evaluating a business, but the number can be dangerously misleading. This article shows how one buyer uncovered a 67% gap between the advertised SDE and the actual cash flow he would keep. You’ll learn why salary, depreciation, and financing adjustments distort the picture—and how to recast the numbers into real buyer cash flow. A must‑read before committing to any business purchase.
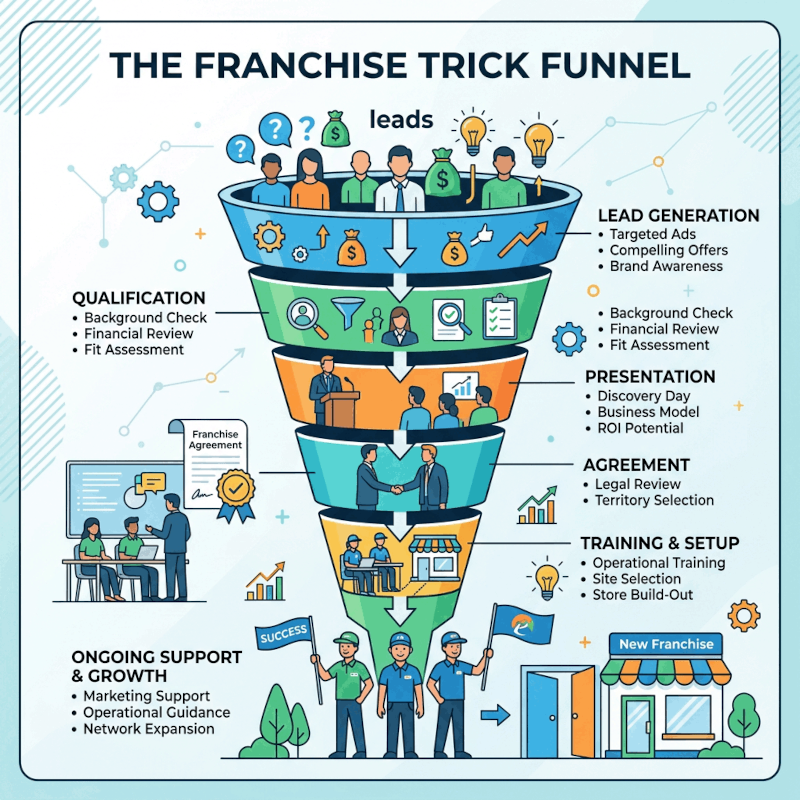
Choosing a franchise often takes months of effort and uncertainty. The article outlines a faster path: applying an early financial screen with just three key metrics—investment, revenue, and margin—to quickly decide if an opportunity deserves deeper due diligence

Many first‑time buyers feel safe when payback looks acceptable. But what if a small dip in revenue erases NPV? This article shows why break‑even and margin of safety matter more than payback — and how to calculate them before you commit

A quick feasibility screen can save you from costly mistakes in business acquisitions. In just 10–15 minutes, you can test whether a deal's economics make sense, spot red flags, and decide if it's worth deeper due diligence. Tools like Instant Investment Analysis help you filter opportunities fast — before investing time, capital, or effort.

Traditional variance analysis shows percentages and differences, but it doesn't answer the key question in FP&A: how did specific changes impact revenue in dollar terms? That's exactly what driver-based (factor) analysis delivers — it breaks total revenue variance into clear monetary effects from volume, price, and other business drivers. In this video, we demonstrate how to perform this analysis in a simple, structured, and highly practical way — without complex spreadsheets or heavy modeling. If you want to move beyond “favorable/unfavorable” labels and clearly quantify what actually drove your revenue change, this video is for you.
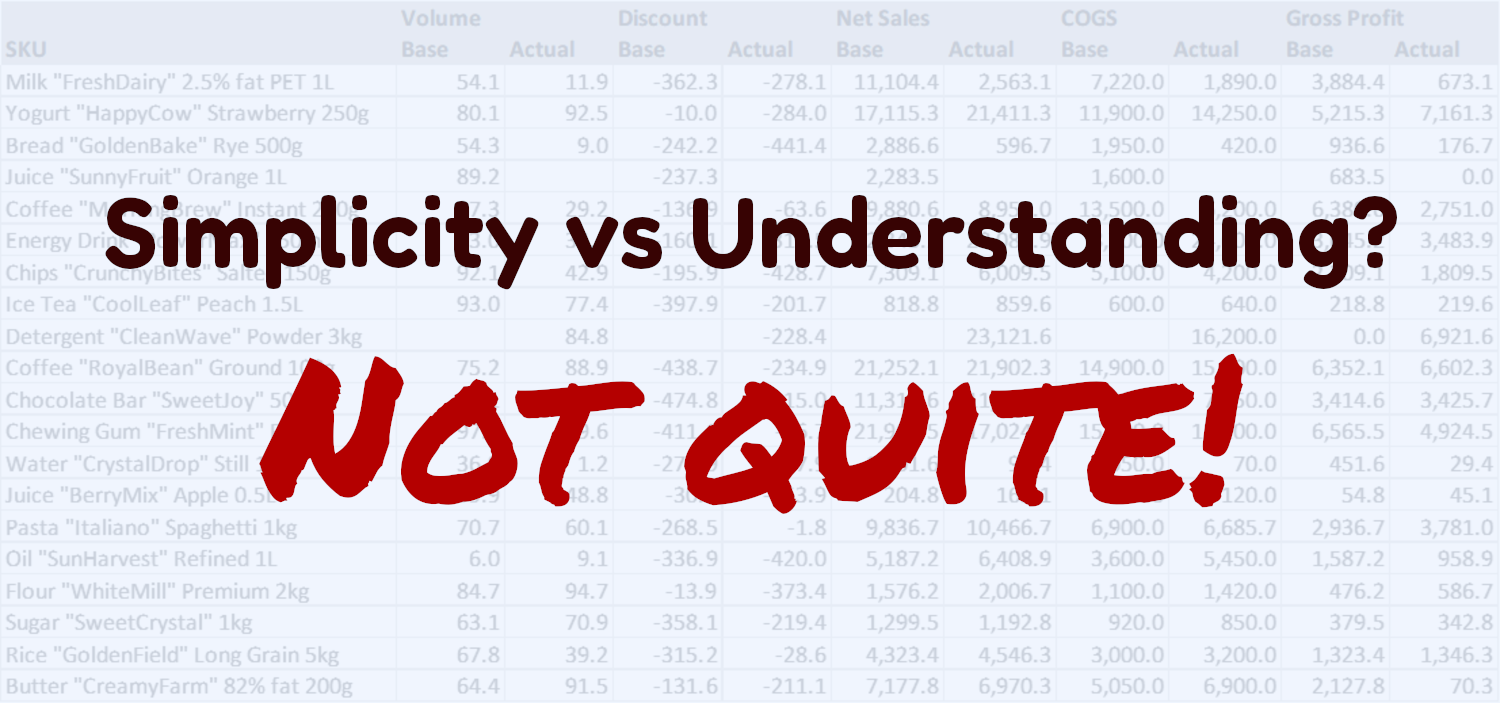
A simple variance shows changes but not their causes. Advanced analysis breaks results into drivers—Volume, Mix, Discount, COGS, Price, plus new and delisted SKUs—quantifying each impact, but it is more complex. What's the right choice?
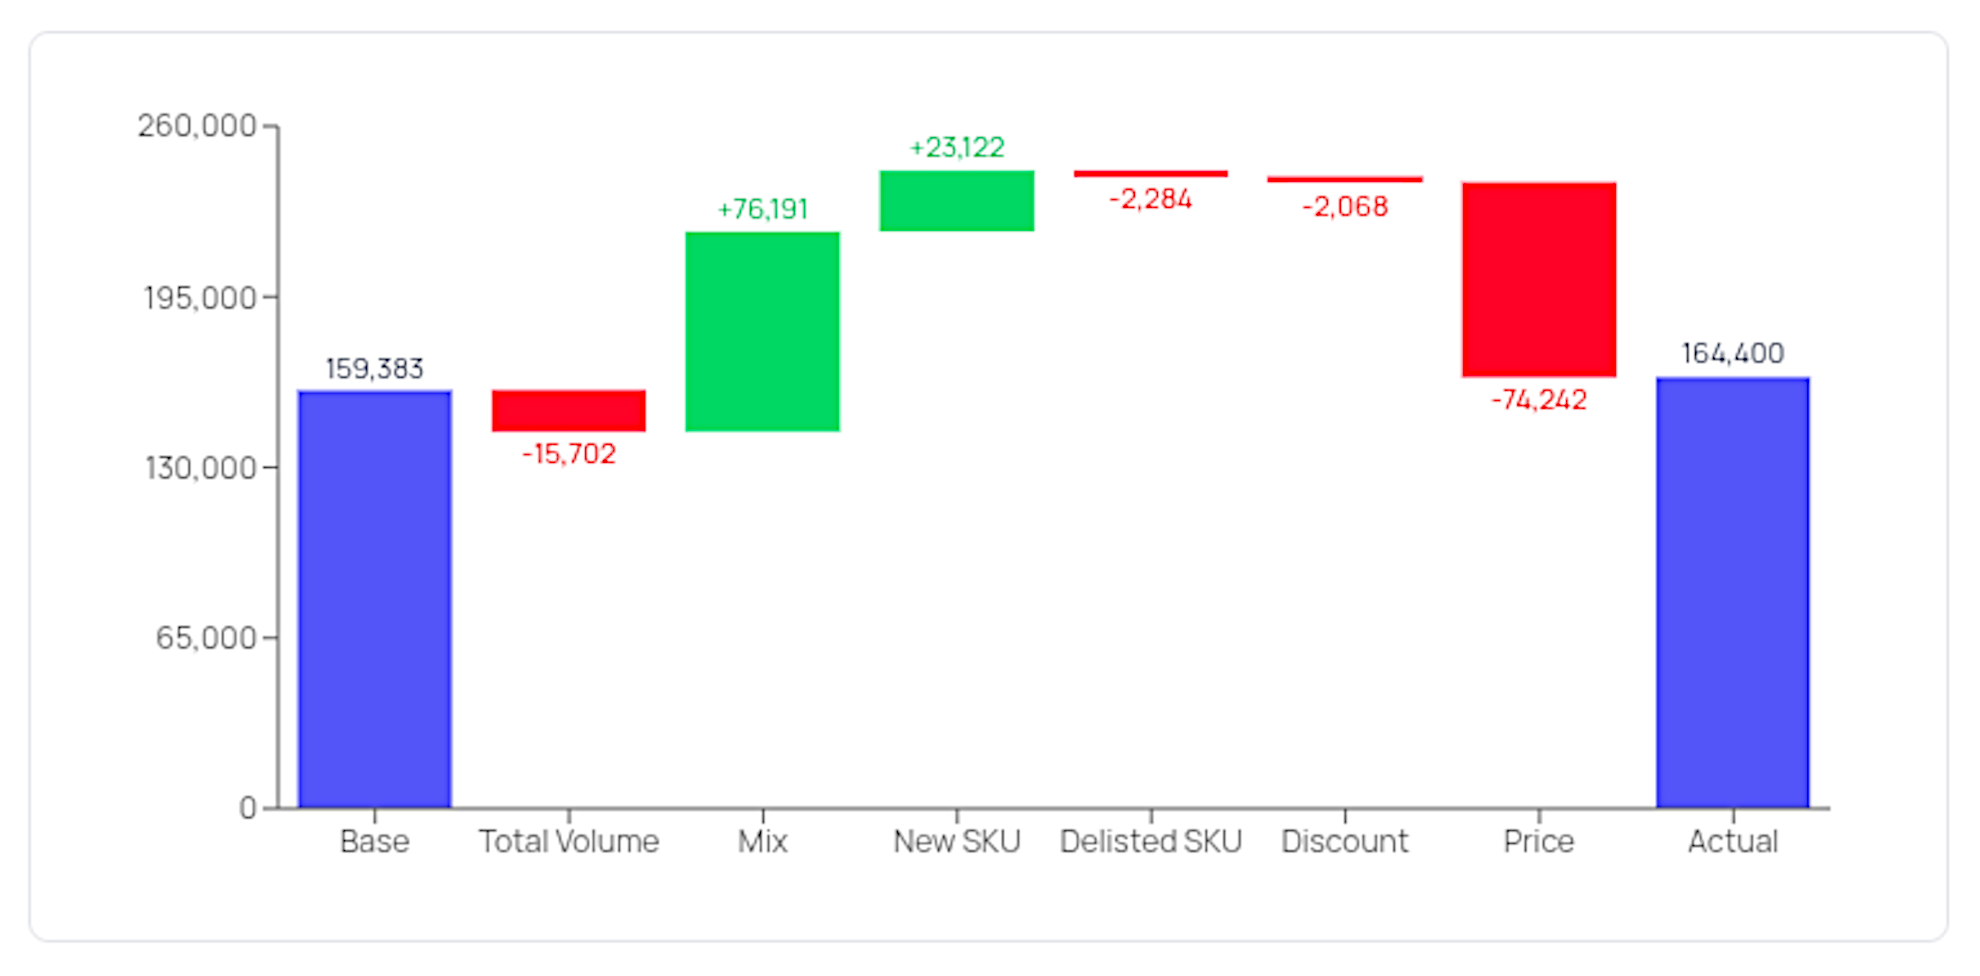
Revenue Variance Analysis helps companies quickly identify why revenue changed by breaking results into drivers such as volume, mix, discount, and price. The Fincontrollex tool automates this process: simply upload your data and get instant results. You'll see a waterfall chart, factor tables, and product-level insights without complex formulas. It's the fastest way to understand what drives revenue variances.

This Excel template helps analyze your assortment by revenue and margin per SKU. It cleans data, runs ABC analysis, segments products, and visualizes results via dashboard and detailed recommendations. Based on Fincontrollex methodology.
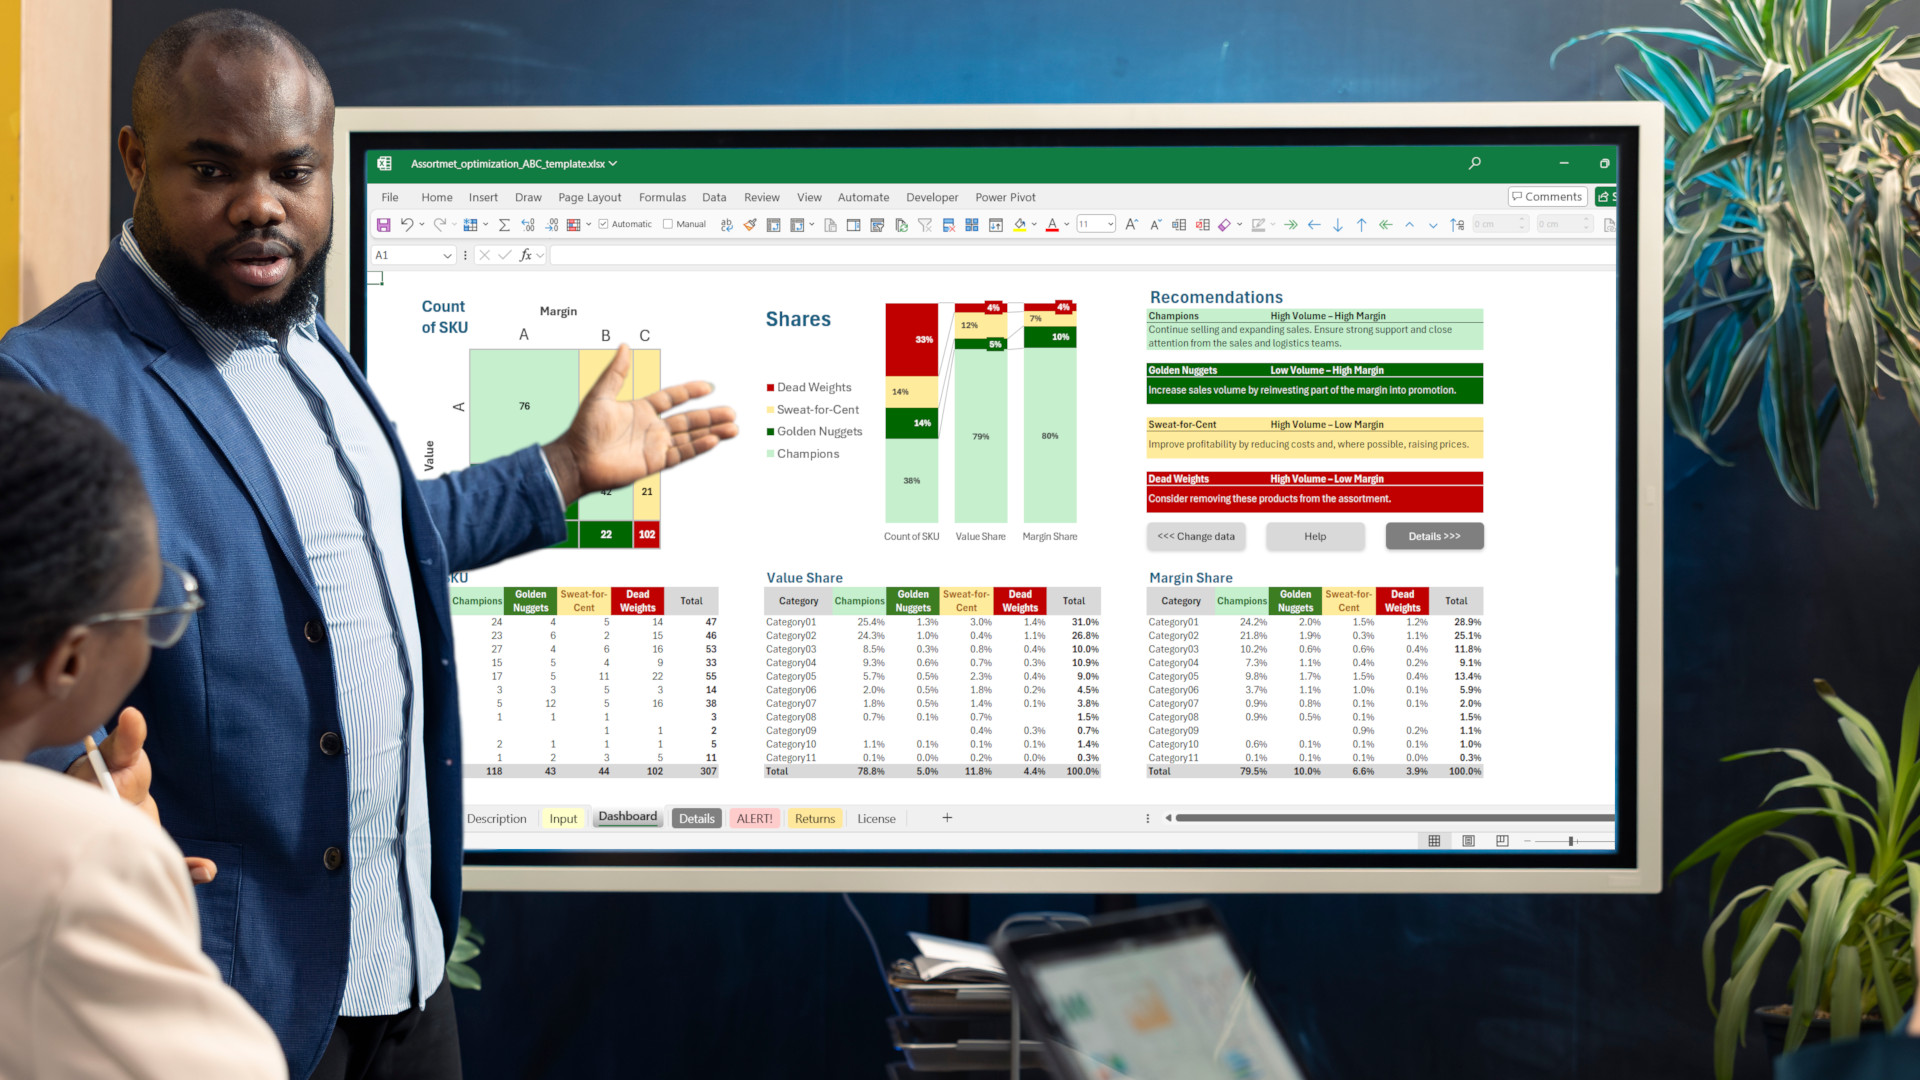
Learn how to boost business profitability through assortment optimization. This article explains a proven ABC-based method and offers a free Excel template to analyze your product mix and apply targeted recommendations.