To understand the reasons behind a revenue variance, companies typically perform a factor (driver-based) analysis. This method decomposes the total variance into individual drivers expressed in monetary terms. In most cases, this analysis is built in spreadsheets, and the calculation comes with several practical challenges (building complex formulas, creating a waterfall chart, etc.). By reading this article, you will learn how to run this analysis using only the raw input data. This is the fastest approach available today.
A few words on calculating a variance (factor-based) analysis
The most common way to analyze variances is to calculate absolute and relative variances. Absolute variance answers the question, “By how much did the metric change?” (Abs Var = actual − base), while relative variance expresses that change as a percentage (% Var = Abs Var / base). This makes it easy to see how volumes, prices, and discounts changed in physical units and in percentage terms. This approach is simple and intuitive, but it does not answer the core question: how did these changes impact revenue in monetary terms? That is exactly what Revenue Variance Analysis is designed to address.
Revenue Variance Analysis allows to highlight the influence of the following factors according to special formulas:
1. Change in total sales volume
(TotalVolumeactual - TotalVolumebase) * Mixbase * Pricebase * (1 - Discountbase)
2. Change in assortment (product mix)
TotalVolumeactual * (Mixactual - Mixbase) * Pricebase * (1 - Discountbase)
3. Change in discount
TotalVolumeactual * Mixactual * Pricebase * (1 - Discountactual + Discountbase)
4. Change in price
TotalVolumeactual * Mixactual * (Priceactual - Pricebase ) * (1 - Discountactual)
In addition to these drivers, teams often isolate the separate impact of newly launched products (if Volumebase, = 0 and Volumeactual ≠ 0)and products that were discontinued (if Volumeactual, ≠ 0 and Volumebase = 0). This is done by filtering variances by condition, which is why these drivers are referred to as conditional.
The formulas used for driver analysis are significantly more complex than the formulas for absolute and relative variances. Performing driver analysis requires deeper expertise in financial analysis and spreadsheets. Fortunately, Fincontrollex has released a tool that fully automates Revenue Variance Analysis: https://www.fincontrollex.com/analyses/revenue-variance-analysis
Fincontrollex Revenue Variance Analysis
The Fincontrollex revenue driver analysis service is available at: https://www.fincontrollex.com/analyses/revenue-variance-analysis/app
You can use this tool completely free of charge; registration is required. Therefore, when you open the page, you should register first. The registration process is standard: enter your name, email address, and password (with confirmation), and accept the terms. Then wait for the confirmation code sent to your email address and verify your email.
After signing in, you will see two buttons: “Download Template” and “Upload Template”.
The workflow is very simple:
- Download the template (click “Download Template”).
- Populate the downloaded template with your data.
- Upload the completed template for analysis (click “Upload Template”).
Preparing the template
The template consists of two tabs:
- data - for your data input
- how to use -detailed instructions for completion
On the data tab, you should clear the existing sample data and replace it with your own. In column A starting from row 3, paste your list of product names. Then complete Volume, Discount, and Net Sales for two periods: the base period and the period you want to compare against (for example, prior month actuals vs. current month actuals; or budget vs. actuals). You can label the compared periods as follows: in cell B2 — the base period name; in cell C2 — the actual period name. You can also specify units of measure for Volume (cell C1, default is ton) and for Revenue (cell G1, default is $). For more detailed guidance, see the “how to use” tab. Once the data is filled in, upload the template on the service page using “Upload Template”.
Revenue Variance Analysis results
After the upload is completed, you will immediately see the results of the revenue driver analysis (as in the screenshot below).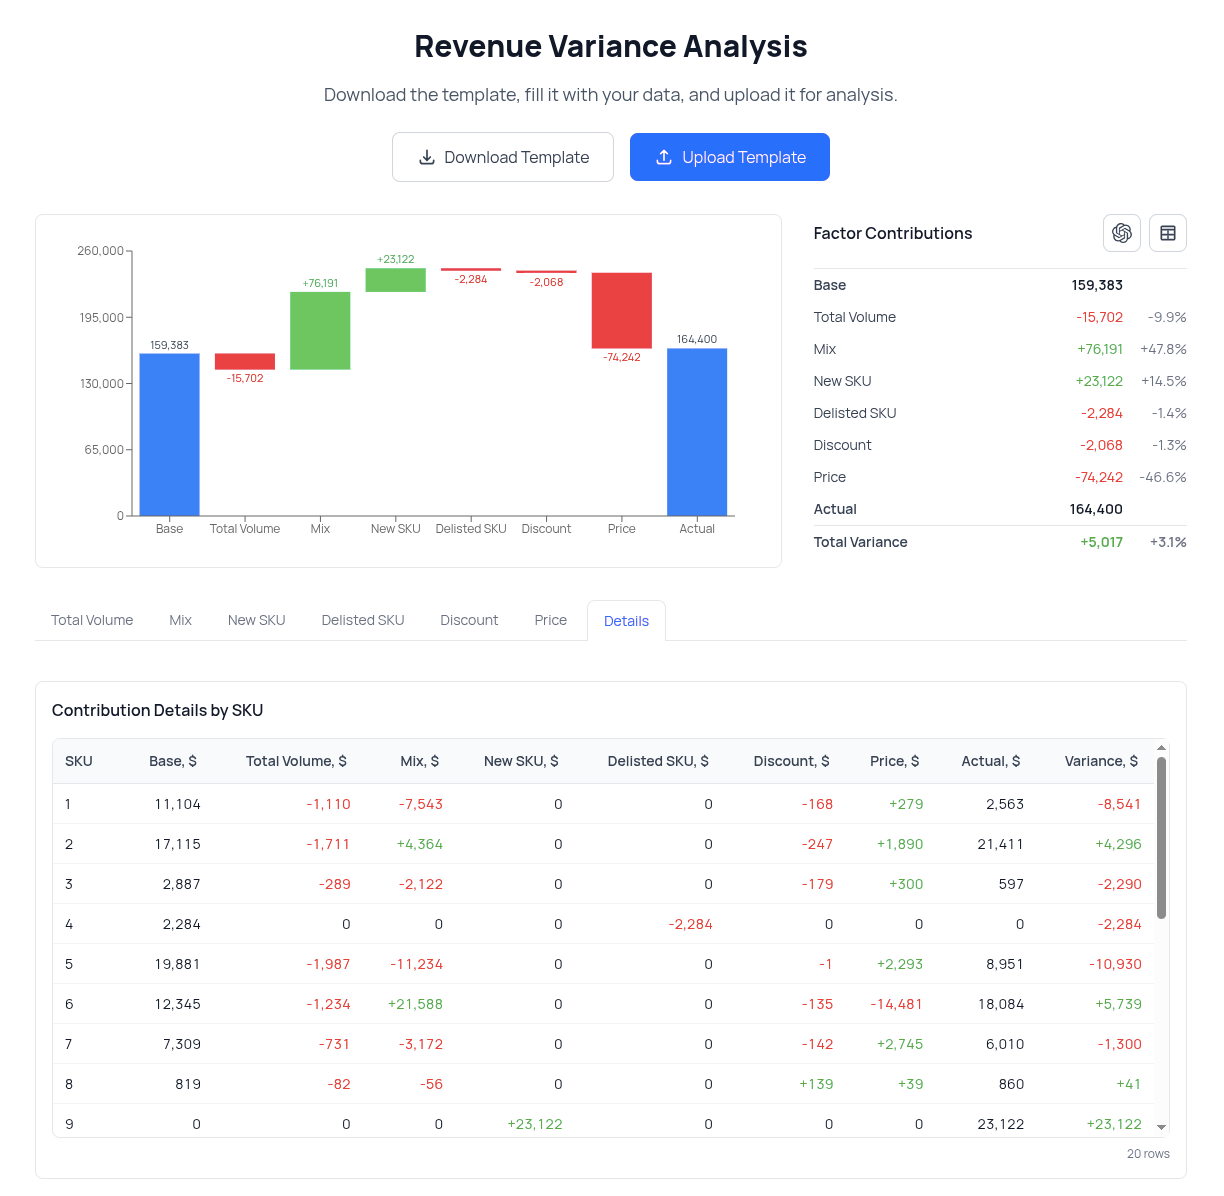
Let's review in more detail what Fincontrollex provides.
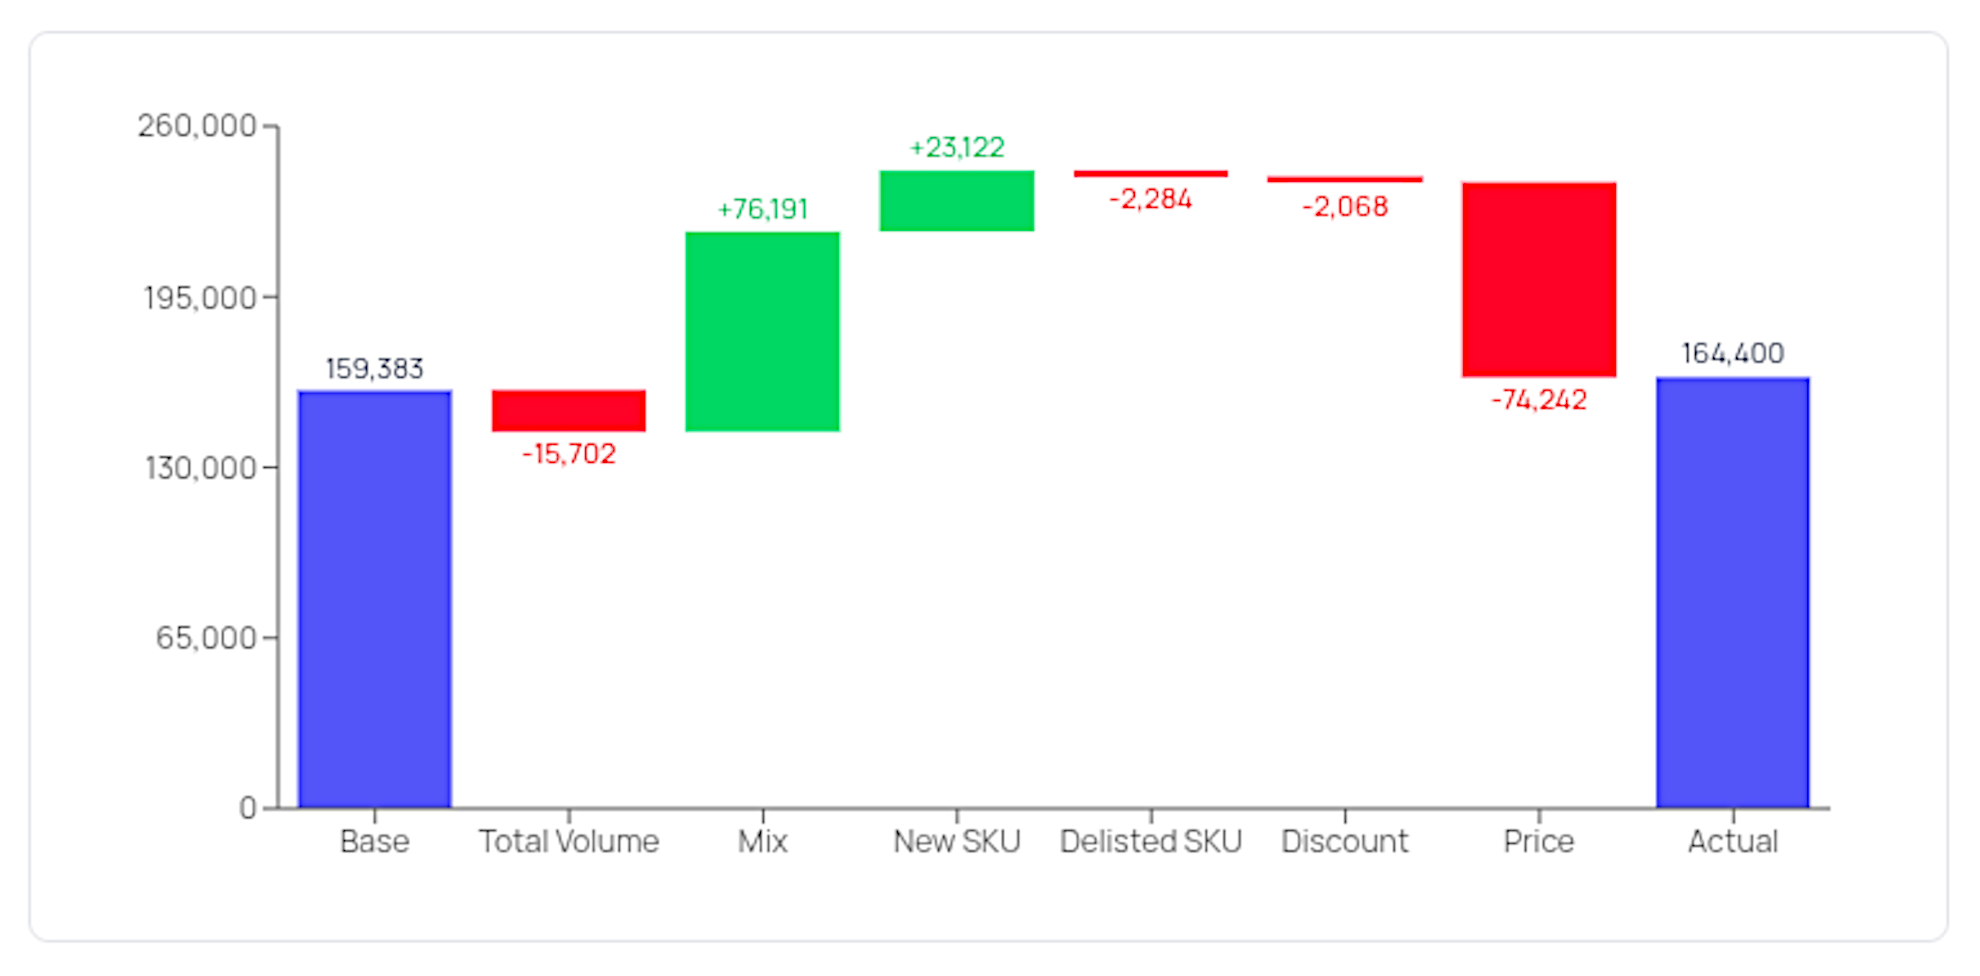
Waterfall chart

The waterfall chart allows you to quickly understand which drivers increased revenue and which decreased it. For example, in the chart above, the assortment (mix) driver has the largest positive contribution to revenue growth, while the price driver, conversely, contributed to a decline. This means revenue changed primarily due to a shift in mix toward higher-priced products (+$76,191) and due to a drop in prices (−$74,242). Next, we will look at how to identify the key products that drove these effects.
Factor Contributions
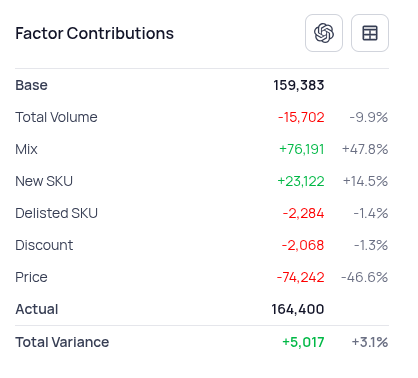
This is a tabular presentation of the revenue variance analysis results. In addition to the waterfall chart, this table shows the absolute change in revenue (+5,017) and the percentage change (+3.1%) for each driver.
Note the two buttons in the top-right corner of the table.
- The left button allows you to send a ready-made prompt with the analysis results to ChatGPT and receive a short summary of the findings. This feature is especially useful for those preparing commentary for other stakeholders.
- The right button allows you to export the analysis results to an Excel file. This is useful for those who want to perform additional analysis or use the output for other purposes.
Detailed driver analysis
Results should be analyzed from the general to the specific: first, identify the drivers that had the largest impact on the outcome; then identify the products and the variances within those products that produced such changes. This section is specifically designed for that drill-down.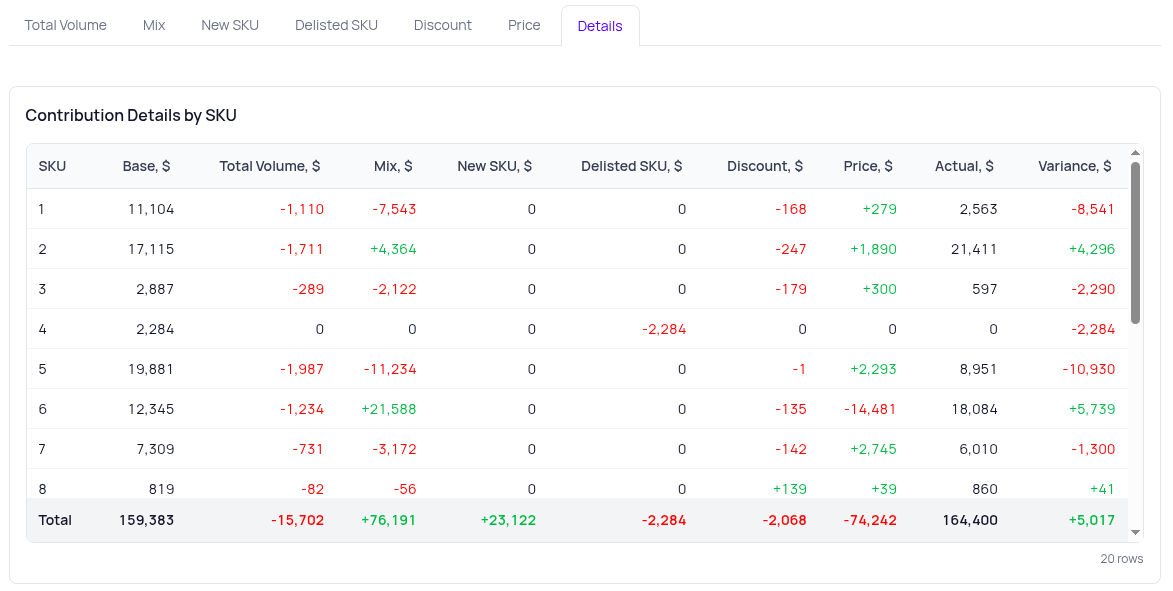
By opening the tab for the driver you are interested in, you can see the Top 5 products that contributed to that driver, as well as a table with absolute and relative variances across all products. On the Details tab, you can review the calculation of each driver by product.
Earlier, we determined that the primary drivers of the revenue change were assortment (mix) and price. Moreover, the price driver reduced revenue by $74,242. Let's move to the Price tab and identify the product-level changes that caused this outcome.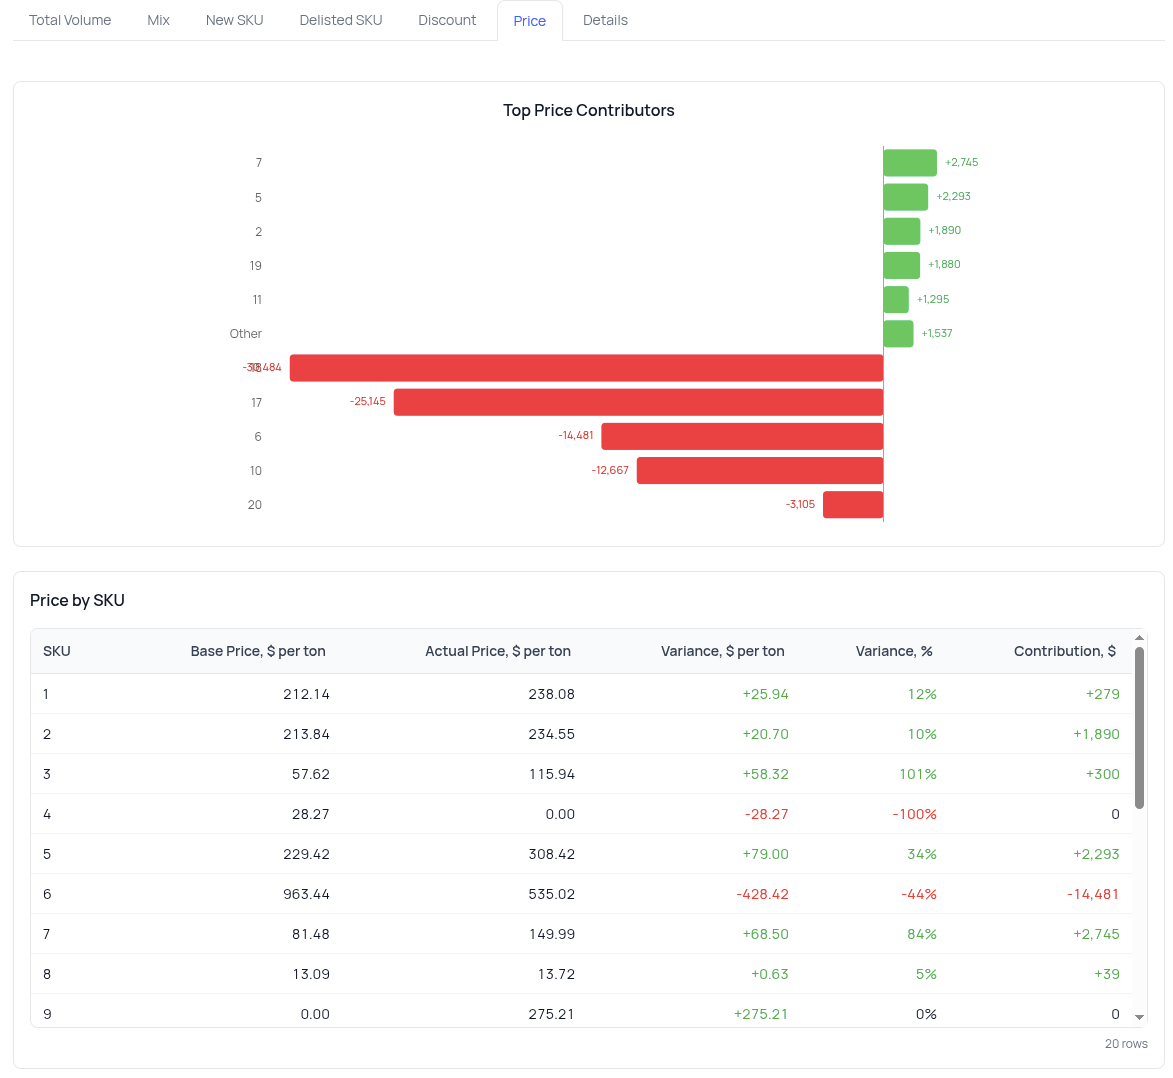
In the chart, we see that the main negative impact on price comes from changes in four products: 18, 17, 6, and 10. Let's sort the table in ascending order to bring these products to the top. To do so, double-click the Contributions column.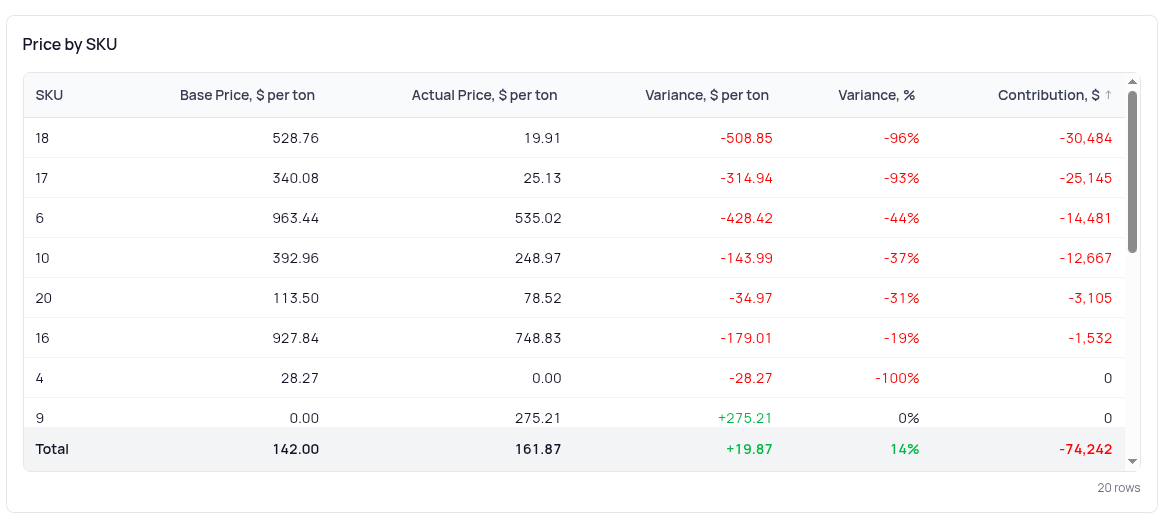
Now we can see exactly which product price changes drove the revenue impact. For example, for product 18: a decrease in price by $508.85 per ton (or 96%) resulted in a revenue decrease of $30,484 in monetary terms.
Similarly, we can identify the reasons behind variances for any driver of interest and understand what requires focus and effort to increase revenue.
Conclusion
Fincontrollex Revenue Variance Analysis is a powerful tool that saves substantial time. There is no longer any need to wrestle with spreadsheet formulas. By providing inputs for only three metrics, you obtain all the information required for analysis: a waterfall chart, a table with total driver impacts, and a driver-by-driver product-level drill-down including absolute and relative variances. But that is not all. You can export the calculation results directly to an Excel file. And if you need executive-level conclusions, simply send the prepared prompt to ChatGPT and it will write them for you. You extract maximum insight with minimal effort and focus on the variances. Isn't this the fastest way to understand what is driving your revenue variance?
If you need to analyze variances not only in revenue, but also in gross profit, margin, COGS, logistics, working capital, or any other metric in your business — as well as compare business units, regions, or sales channels — take a look at Fincontrollex Variance Analysis