
If you've ever considered starting your own business, buying a franchise, or acquiring an operating company can feel like a safer way to invest than starting from scratch. A business like this is already “market-tested”: it has a track record of demand and cost structure, so the risk of failure is typically lower.
But early in the process, one key question remains: how realistic are the numbers you see in a listing or the seller's teaser deck? Before an NDA is signed, detail is usually limited. So you need a fast way to assess whether the economics look credible, what questions to ask next, which levers to use in the next discussion (price, terms, deal structure), and what red flags to watch for. The cost of getting it wrong isn't just time: it can mean your own capital, loans, and months of effort. A mistake can easily cost tens, and sometimes, hundreds of thousands of dollars.
So how do you decide quickly whether it's worth continuing to evaluate an opportunity and investing time in deeper work? Before an NDA and access to documents, you often have only a few data points (for example: asking price, revenue, cash flow/EBITDA, year established). And this is exactly where it's easy to drift into market research (market size, competitors, locations), scenarios and assumptions (revenue up/down, margin, seasonality), and building an “ideal” financial model.
You need a fast filter that, in 10–15 minutes, shows whether a deal passes a basic economic sanity check, and what to bring into the next round of negotiations.
The Early-Stage Reality: You Don't Have the Data Yet (and That's Normal)
At the “interesting / not interesting” stage, it's common that:
- The NDA isn't signed yet, so financial detail is unavailable because you don't have the seller's full document package (P&L, tax returns, unit economics, customer cohorts, leases, etc.).
- For franchises, the FDD (Franchise Disclosure Document) and details on fees/royalties/required purchases/territory are often not available immediately.
- A 100% market assessment is not possible yet—you're working with hypotheses, ranges, and indirect signals.
Still, you have to make a decision: go deeper (due diligence, negotiations, document requests) or stop.
What to Do Instead of an “Ideal Model”: A Feasibility Screen
A feasibility screen is a preliminary deal screening that tests whether an idea can hold up economically under reasonable ranges of assumptions.
The goal is to quickly convert “this looks promising” into numbers and see:
- Does the deal create value?
- How sensitive is it to revenue and margin?
- Where is the break-even revenue point?
- What multiple are you effectively paying for the cash flow?
- Is the payback period acceptable?
You can build this screen manually in Excel (NPV/IRR/Payback plus sensitivity tables), but that takes time and solid formula discipline. To speed up the first-pass answer, you can use a structured Excel template or an online tool like Instant Investment Analysis—where the metrics are calculated instantly from a minimal set of inputs:
https://www.fincontrollex.com/analyses/instant-investment-analysis
A Real-World Example (BizBuySell)
Let's take a practical example: a real kitchen remodeling business listed on BizBuySell, and see what insights you can get from a minimal data set.
Step 1. Identify the Data Available for Calculation
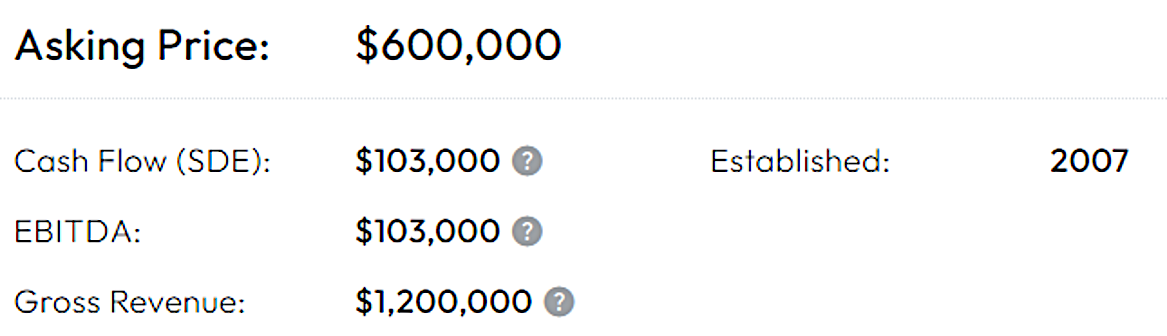
The listing provides the following:
- Asking Price: $600,000
- Cash Flow (SDE) / EBITDA: $103,000
- Gross Revenue: $1,200,000
- Established: 2007
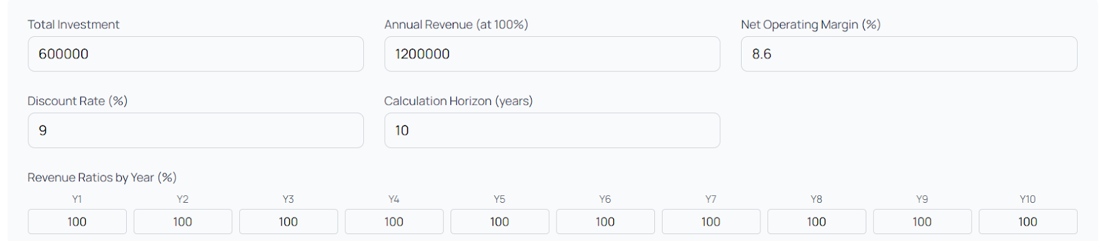
Next, enter these assumptions into Instant Investment Analysis:
- Total Investment = 600,000
- Annual Revenue (at 100%) = 1,200,000
- Net Operating Margin = 8.6% (approximately $103k / $1.2M)
- Discount Rate = 9%
- Horizon = 10 years
- Revenue ratios = 100% each year (optimistic assumption that revenue will not decline after the ownership transition)
Step 2. Get Results Instantly
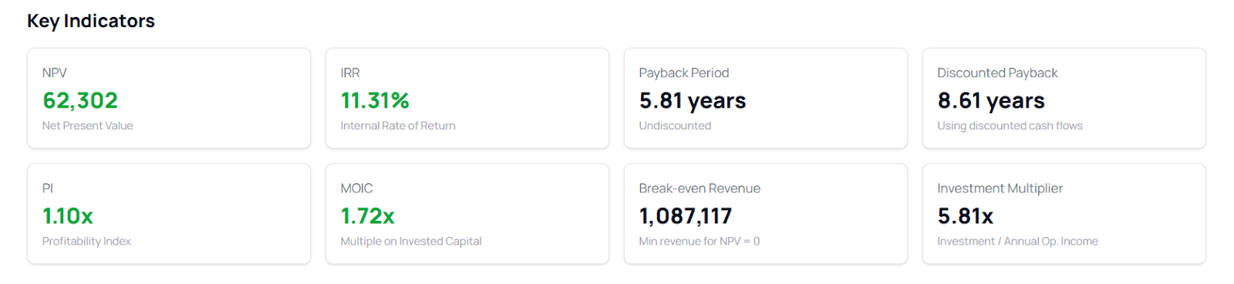
The tool shows:
- NPV = $62,302
- IRR = 11.31%
- Payback = 5.81 years
- Discounted Payback = 8.61 years
- PI = 1.10x
- MOIC = 1.72x
- Break-even Revenue = 1,087,117
- Investment Multiplier = 5.81x (Price / Annual Operating Income)
How to Read the Metrics (Plain English)
- NPV (Net Present Value): how much value (in dollars) the project creates after discounting. NPV > 0 means it clears the required return.
- IRR (Internal Rate of Return): the project's implied annual return. Higher relative to your hurdle rate is better.
- Payback Period: how long it takes to recover the investment using undiscounted cash flows.
- Discounted Payback: the same concept, but using discounted cash flows (a stricter view).
- PI (Profitability Index): how much present value you get per $1 invested. PI > 1 is generally acceptable.
- MOIC (Multiple on Invested Capital): total cash returned divided by total investment (your money multiple).
- Break-even Revenue: the minimum annual revenue required for NPV = 0. Below this level, the deal stops creating value.
- Investment Multiplier: a quick multiple that approximates how many times you're paying the annual earnings/cash flow (Price / Annual Operating Income).
These definitions are simplified to make the concepts easier to understand. For more precise definitions, you can refer to Investopedia and similar references.
What This Means for a Prospective Buyer
- You are paying ~5.8× annual cash flow (or operating income). For a small business, that can be aggressive unless there are clear “premium” attributes (growth, low owner-dependence, strong brand/contracts, etc.).
- The revenue cushion is thin. Break-even Revenue is 1,087,117 versus current revenue of 1,200,000. That means NPV goes to zero with roughly a 9.4% revenue decline ( (1,200,000 − 1,087,117) / 1,200,000 ≈ 9.4% ).
Note: this example uses an optimistic assumption that revenue will not drop after the ownership transition. In practice, a temporary decline in revenue and/or margin during the transition is common.
- The payback is long for the level of uncertainty. A 5.81-year payback and 8.61-year discounted payback over a 10-year horizon means you spend most of the horizon earning back the purchase. So small errors in assumptions (margin, lead flow, staffing, competition, seasonality) can materially worsen the outcome.
Bottom Line: A Simple Business Valuation Saves Time and Mistakes
Should you keep evaluating a business like this on these terms? In many cases, the answer is “no”, or “only if the terms change.”
The logic is simple: a thin revenue cushion + a high multiple + a long payback = a weak risk profile at the initial-offer stage (before an NDA and deeper analysis).
A first-pass feasibility check helps you quickly eliminate weak opportunities. If a deal passes the screen, the next step is a more detailed model and due diligence: validating cash flow, building scenarios, and identifying risks.
If you need support building more accurate models and running due diligence at the next stage, reach out to Fincontrollex: https://www.fincontrollex.com/analyses/custom-analysis