
The goal of any business is to generate profit. One way to increase profitability is through assortment management. This article describes a methodology for boosting profit by optimizing the product mix and provides a free Microsoft Excel template that applies this method.
For a practical case study, see: How one of the Fincontrollex Clients Increased Margin Income by +35% — A Case for Senior Managers >>>
Description of the Methodology
The essence of approach
Assortment management is carried out in order to:
- maximize revenue,
- eliminate unprofitable items,
- strengthen sales of the most profitable products.
The methodology helps focus efforts on specific products: to analyze the assortment and determine which actions should be applied to each product depending on its contribution to total revenue and margin.
The Analysis Consists of Four Stages
- Data preparation
- Classification of products into ABC classes
- Grouping of ABC classes into segments with recommendations
- Visualization of results
1. Data preparation
The analysis requires data containing revenue and margin at the Category–SKU level. A sample is shown in Figure 1.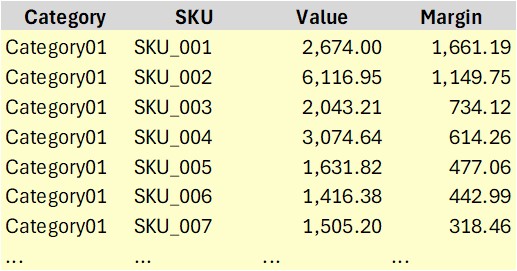 Figure 1. Sample Data for Analysis.
Products with negative revenue or negative margin should be excluded. Such products require special attention: the reasons for negative values must be identified.
Once the data is cleaned, the analysis can begin.
2. Classification of Products into ABC Classes
Products are divided into ABC classes using multidimensional ABC analysis. Products are divided into ABC classes within each product category based on several indicators—in this case, revenue and margin. The classification of each product is performed separately for each indicator.
For revenue: Products are sorted by descending revenue. The cumulative share of each product in total revenue is calculated. Then each product is assigned to a class according to the cumulative share threshold.
Class thresholds used in this method are: A — 0% to 80%; B — 80% to 95%; C — 95% to 100%. These ranges are the classical boundaries of ABC analysis, derived from the Pareto principle (20/80). While this choice is popular for its simplicity, it is neither universal nor optimal. Different companies may use different thresholds. More precise limits can be determined using other methods (e.g., the “Pareto elbow method”, also known as “Pareto inflection point method”), which will be described in a separate article.
As a result, Class A includes products with the highest contribution to revenue, representing a cumulative share of 80%. Class B consists of less frequently sold products with a cumulative share of 15% (from 80% to 95%). Class C contains the remaining 5% of revenue, the least sold products.
The same procedure is applied to margin.
3.Grouping ABC Classes into Segments with Recommendations
After the products are classified, the results are entered into a matrix with nine class combinations (see Figure 2).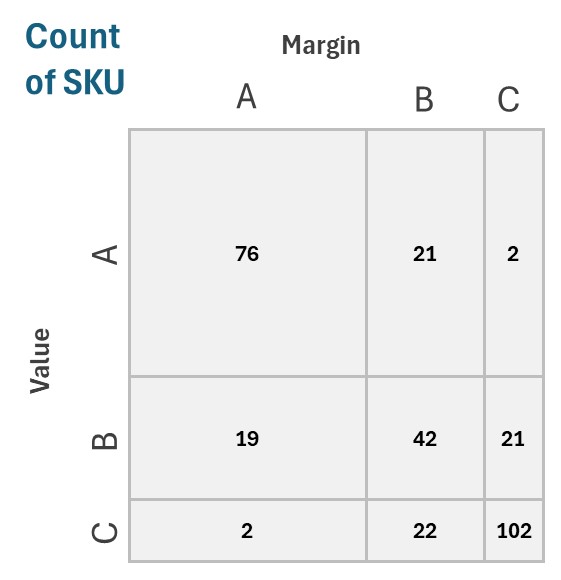 Figure 2. ABC Class Matrix.
Then we group the classes into segments. For example, BA, CA, and CB have low revenue but high margin, so they can be combined into a single segment. As a result, we obtain four product segments, each with specific recommendations (see Figure 3).
To better reflect the essence of each segment, we use the following names:
- Champions: High Volume-High Margin
Groups AA and BB. The best name for them is “Champions,” since they are the leaders in both sales and profitability. This is the most important product segment — the foundation of the company’s revenue and margin. It requires special attention from both Sales and Logistics.
Recommendation: Continue selling and expanding sales, with dedicated focus and support from the sales and logistics teams.
- Golden Nuggets: Low Volume – High Margin
Classes BA, CA, and BC. These are high-margin products with low sales volume, comparable to “Golden Nuggets” — small in quantity but highly valuable.
Recommendation: Increase sales volume by reinvesting part of the margin into promotion.
- Sweat-for-Cent: High Volume – Low Margin
Classes AB, AC, and BC. These are low-margin products with high sales volume — “Sweat-for-Cent” items: they place a heavy burden on sales efforts but deliver little profit.
Recommendation: Increase profitability — where possible, raise prices and reduce costs.
- Dead Weights: High Volume – Low Margin
Class CC. These are low-margin products with low sales volume — “Dead Weights.” Such items bring no real benefit to the company, neither in sales nor in profit.
Recommendation: Consider removing them from the assortment.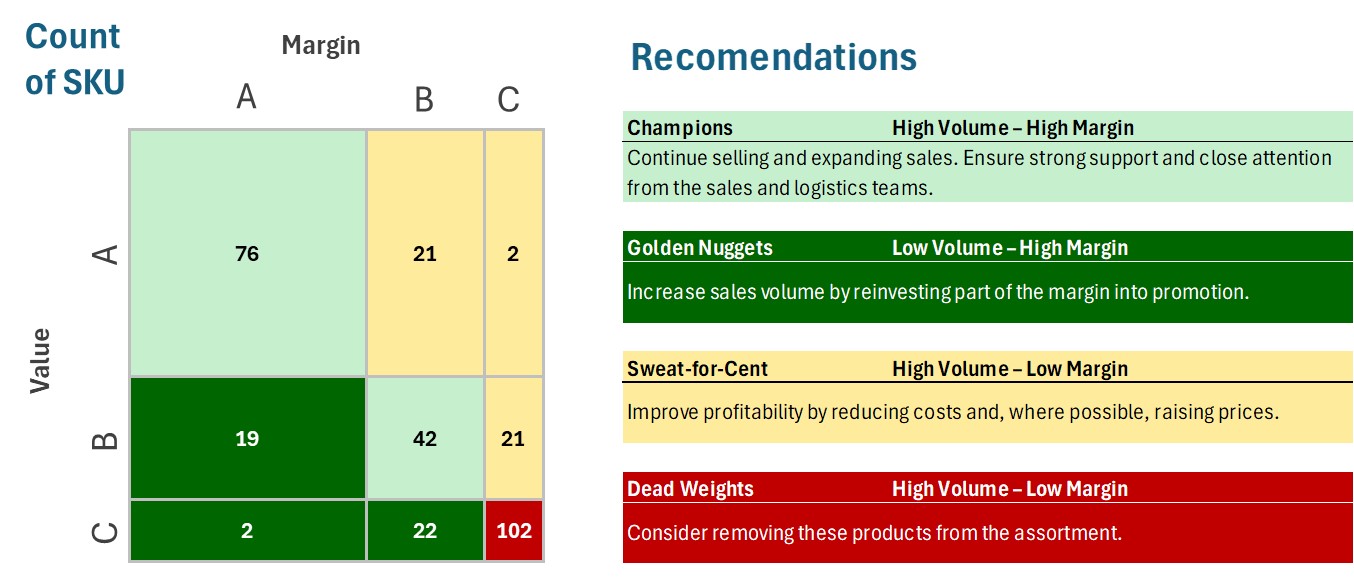 Figure 3. Classes Combined into Segments with Recommendations for Each Segment.
4. Visualization of Results
4.1. Segment Shares
The size of the segments can be visually assessed using a chart (see Figure 4).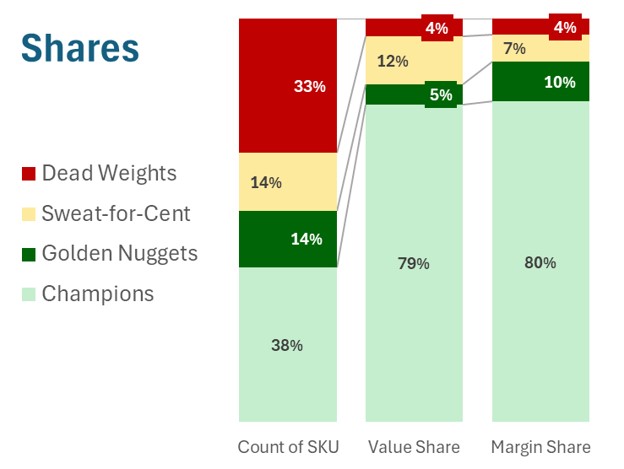 Figure 4. Segment Shares by Number of SKUs, Revenue, and Margin.
As you can see in this example, the Champions segment represents 38% of SKUs and approximately 80% of both revenue and margin. Golden Nuggets account for only 5% of revenue but 10% of margin. Sweat-for-Cent, on the other hand, makes up a larger share of revenue than margin. Dead Weights represent 33% of SKUs but contribute only 4% of revenue and margin.
4.2. Details by SKU
Finally, an example of presenting the analysis results at the product level is shown in Figure 5. You can see each product’s characteristics, its class in revenue and margin, the segment it belongs to, and the corresponding recommendation.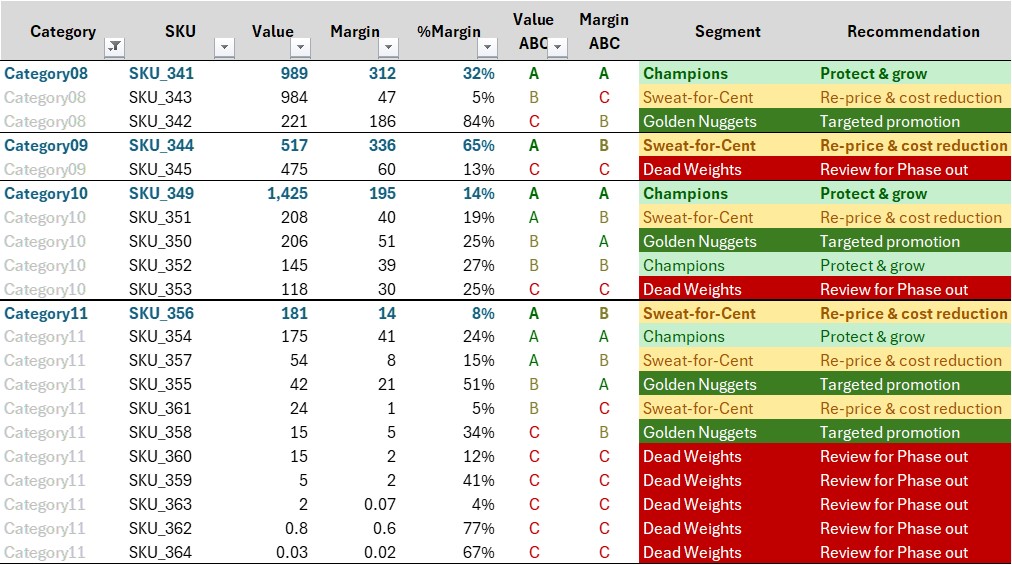 Figure 5. Analysis Results by Product with Segment and Recommendations
Warning
Warning! Please note that recommendations should be applied carefully and with balanced judgment.
For example, increasing the price of a product may lead to a decrease in its sales.
In the case of SKUs recommended for removal from the assortment, it is important first to analyze why they ended up in this segment. Such an SKU may be a new product that has not yet reached a planned sales level, or it may be a by-product generated in the production of core products, where selling it is still more profitable than disposal.
Conclusion
You can now perform a similar analysis for your assortment independently, or by using the free Excel template from Fincontrollex. All you need to do is enter your data, and the template will automatically:
- clean the dataset,
- perform multidimensional ABC analysis,
- group products into four segments, and
- present the results in both a dashboard and SKU-level details with recommendations.
To get the template, register on the website and follow the link>>>.
If you would like us to assist you with assortment management, simply fill out the form at the following link>>>.