
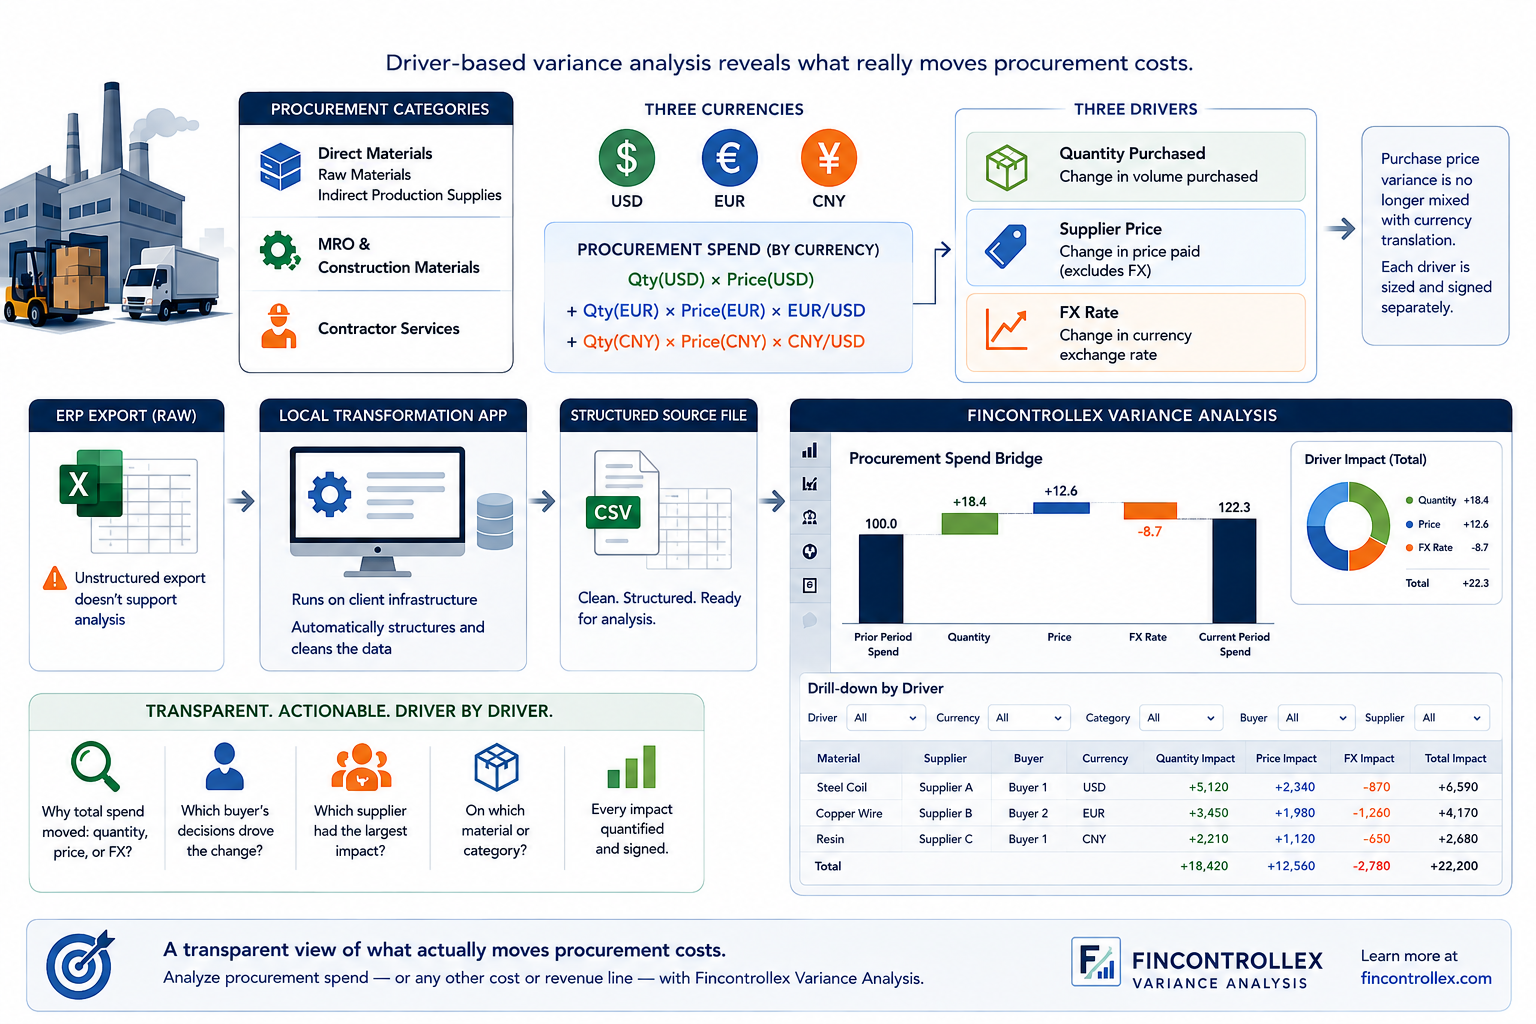
We recently completed a procurement spend analysis project for a manufacturing client. The company buys across several categories — direct materials for production, with raw materials and indirect production supplies broken out separately; MRO and construction materials; and contractor services — and pays in three currencies: US dollars, euros, and Chinese yuan.
To explain period-over-period movements in total spend, we built a driver-based variance model that decomposes the purchase amount currency by currency:
Procurement Spend = Qty(USD-priced) × Price(USD) + Qty(EUR-priced) × Price(EUR) × EUR/USD + Qty(CNY-priced) × Price(CNY) × CNY/USD
The decomposition isolates three drivers: quantity purchased, supplier price, and FX rate. Purchase price variance no longer sits mixed together with currency translation — each is sized and signed separately, so a period where prices held flat but the euro moved reads very differently from one where the buyer actually paid more.
One obstacle came up early: the export from the client's ERP wasn't structured in a way that supported this analysis. To solve it, we built a small web application that runs locally on the client's infrastructure and automatically transforms the raw export into a structured source file.
That file feeds directly into Fincontrollex Variance Analysis, where the client works with a spend bridge and an interactive drill-down on every driver — without manually reassembling data at the end of each period.
Before this, it was hard to say why total spend moved: quantity, price, or FX? Which buyer's decisions drove the change? Which supplier had the largest impact, and on which material? All of it is now visible driver by driver, with each contribution quantified. The client has a transparent view of what actually moves procurement costs.
If you need to analyze procurement spend — or any other cost or revenue line — reach out. Learn more at Fincontrollex Variance Analysis.